5  Functions

5.1 Correlation

5.1.1 base R correlation: cor()

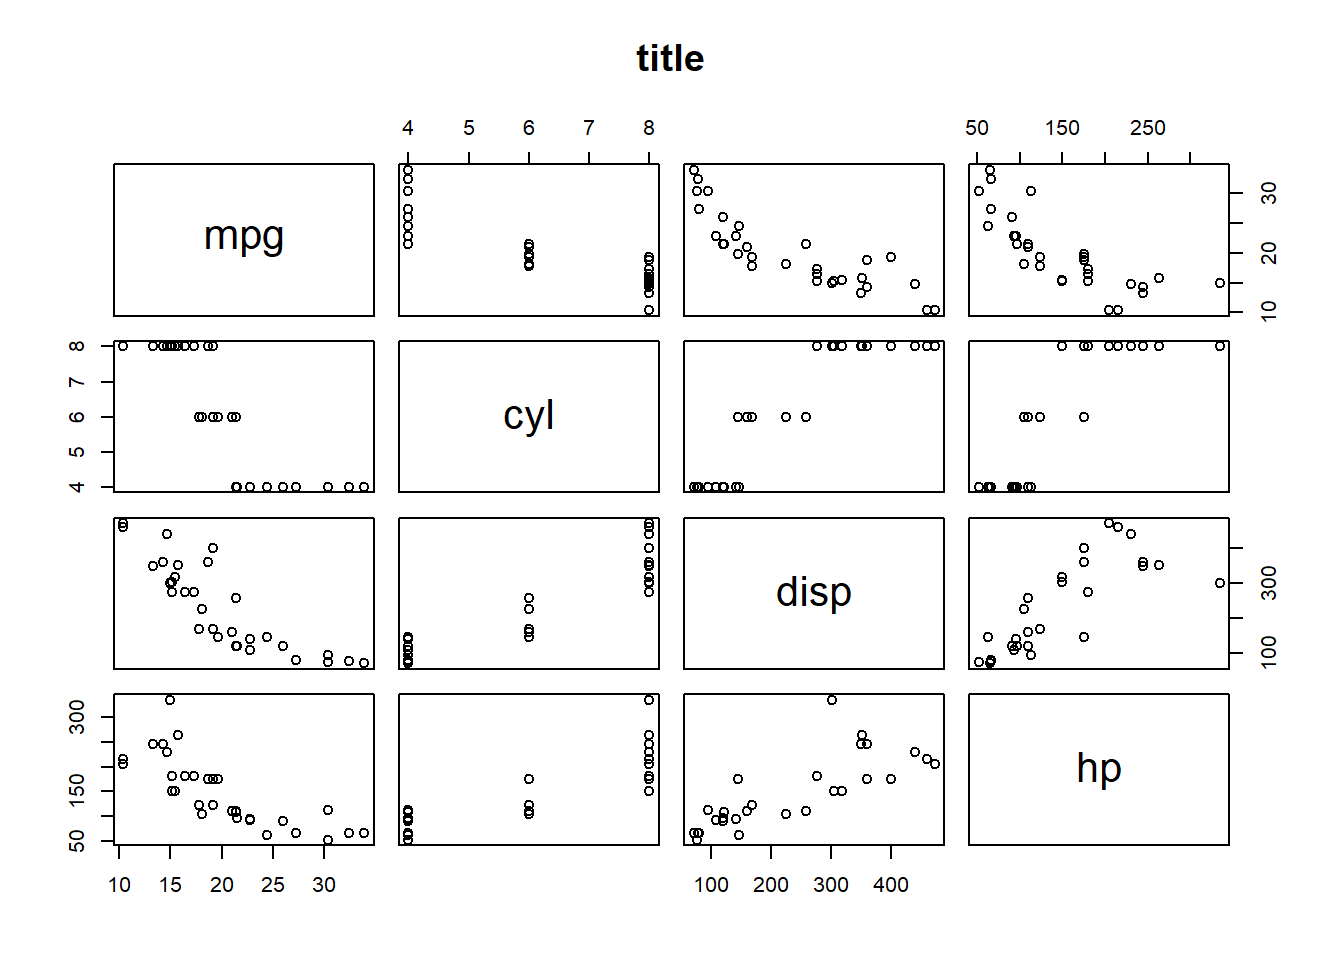
cor(mtcars[,1:4])
            mpg        cyl       disp         hp
mpg   1.0000000 -0.8521620 -0.8475514 -0.7761684
cyl  -0.8521620  1.0000000  0.9020329  0.8324475
disp -0.8475514  0.9020329  1.0000000  0.7909486
hp   -0.7761684  0.8324475  0.7909486  1.0000000

If data has NA’s in any of the values the cor() will results in NA. If you want to remove the NA’s when calculating correlation do:

cor(..., use = "complete.obs")

5.1.2 Dot Plots for Multiple Variables: pairs()

That chart that plots all variables against eachother as a dot plot when looking to see if variables are correlated with eachother

#lots of variables so only look at first 4
testdf <- mtcars[,1:4]
pairs(testdf, main = "title")

5.2 if else

5.2.1 Statements

test expression goes in parenthesis () and the statement goes in the curly brackets {}

if (test) { statment } 

R is a bit finicky with where the brackets go; I get errors when I put else on a new line by itself - it wants to have the right brackets before it; } else

if (test_A) {
statment #1
} if else (test_B) {
} else {
statment #2 
}

5.2.2 Vectorized

ifelse(test, if_true, if_false)

Use case when when have more than 2 options (this is a replacement for nested ifelse() functions)

case_when(
    x == A ~ "a"
  , x == B ~ "b"
  , x == C ~ "c"
  , TRUE    ~ NA_character # catchall, default is NA
  # need to specify *type* of NA
)